
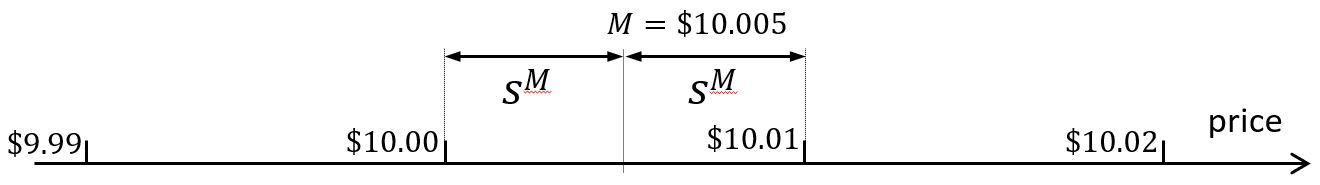
Accurate liquidity measurement is important for liquidity timing and order routing. One of the most prevalent measures is the effective spread, defined as the percentage difference between the transaction price and the bid-ask spread midpoint. For example, if the quotes for a stock are $10.00 to sell and $10.01 to buy, the effective spread of a buy trade at $10.01 is half a cent (about 5 basis points).
To see the logic of the effective spread, consider the market maker who sells to the incoming trader. The market maker provides the service of immediate execution, and in return earns a premium relative the fundamental value of the shares. The effective spread captures that premium, using the spread midpoint as a proxy for the fundamental value.
In a paper recently accepted for publication in Journal of Financial Economics, I challenge the use of the spread midpoint to gauge the fundamental value when measuring the effective spread. I show that the use of the midpoint leads to an overestimation of the “true” effective spread.
To see this, assume that the fundamental value of the stock in the example above is 10 dollars and 0.25 cents. The effective spread is then asymmetric; 0.25 cents for trades on the bid side and 0.75 cents (three times higher) on the ask side. If traders care about transaction costs, the relatively wide ask-side spread deters buyers, whereas the tight bid-side spread may attract sellers. There are then more traders submitting market orders at the bid side, and the true effective spread is, on average, smaller than the average midpoint effective spread (which is 0.5 cents).

How bad is it? I analyze a sample of five trading days for the S&P500 stocks and find that the effective spread is overestimated by 13 – 18%, depending on the benchmark used. The problem is worse in stocks where the tick size is high relative the trade price. For example, the picture below shows that the effective spreads of stocks priced around $10 are overestimated by 52 – 97%. Stocks priced higher than $100 are virtually unaffected by the bias.
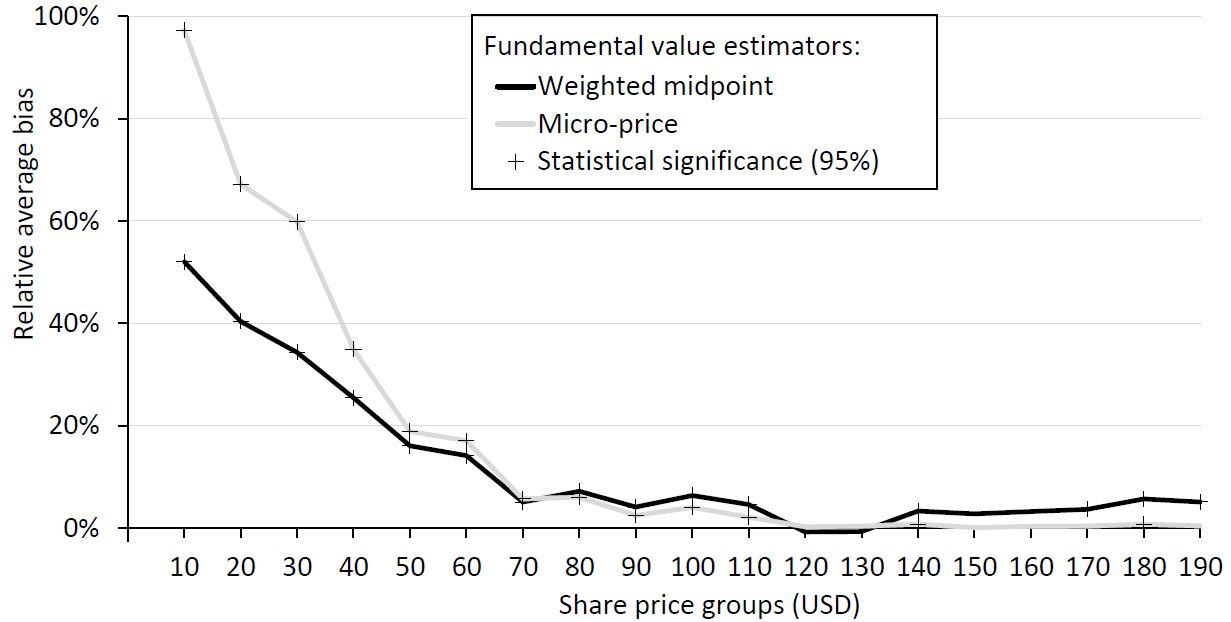
Can the overestimation problem be fixed? To overcome this problem, I argue that the transaction price needs to be benchmarked to a proxy that captures fundamental value variations that are more granular than the observed prices. The paper considers two such proxies: the weighted midpoint and the micro-price. These proxies have in common that they factor in the order book imbalance – the relative depth quoted at the best bid and ask prices. The data required for these proxies are readily available to investors in the SIP feed, and to academics in the TAQ and Tick History databases. Replacing the midpoint with the weighted midpoint implementation amounts to just one line of code (full R implementation, including the micro-price, is available here):
# MidpointX = (P_ask + P_bid) / 2;
# Weighted midpoint
X = (P_ask * Q_bid + P_bid * Q_ask) / (Q_bid + Q_ask);
Should investors care? I show in the paper that 44% of the liquidity variation in the S&P500 stocks happens at a sub-tick level. That is, it is variation due to fundamental value fluctuations that are too small to register in the displayed prices. Anyone who uses the midpoint as benchmark for the cost of trading will overlook such fluctuations. In a simulated liquidity demand strategy, I show that the transaction cost of a trader who tracks the weighted midpoint or the micro-price is 43 – 44% lower than for someone watching the midpoint.
The full text article is available with open access at Journal of Financial Economics.
This text was originally posted on March 28, 2017. The updated version was published on November 23, 2020.
